


| Rank This Year | Rank Last Year | Company | Revenue (000) | Net Income (000) | Employees | Tractors* | Trailers |
|---|---|---|---|---|---|---|---|
| 1 | 1 | UPS Inc.
|
74,094,000 | 4,440,000 | 495,000 | 19,851 | 107,542 |
| 2 | 2 | FedEx Corp.
|
68,869,000 | 2,359,000 | 475,000 | 29,813 | 113,218 |
| 3 | 3 | XPO
|
16,648,000 | 379,000 | 100,000 | 15,500 | 40,000 |
| 4 | 4 | J.B. Hunt Transport Services
|
9,165,258 | 516,000 | 29,106 | 17,972 | 35,093 |
| 5 | 7 | Schneider
|
5,000,000 | 147,000 | 15,650 | 9,000 | 35,100 |
| 6 | 6 | Yellow Corp.
|
4,871,200 | -104,000 | 30,000 | 14,100 | 43,700 |
| 7 | 5 | Knight-Swift Transportation Holdings
|
4,843,950 | 310,178 | 23,800 | 19,520 | 58,315 |
| 8 | 9 | Old Dominion Freight Line
|
4,109,111 | 615,518 | 21,159 | 9,296 | 37,539 |
| 9 | 8 | Landstar System
|
4,084,577 | 227,720 | 1,333 | 10,243 | 17,067 |
| 10 | 11 | Ryder System
|
3,968,754 | 226,209 | |||
| 11 | 10 | TFI International
|
3,903,828 | 233,891 | 16,700 | 15,844 | 25,505 |
| 12 | 12 | Hub Group
|
3,668,117 | 107,171 | 5,000 | 3,900 | 4,920 |
| 13 | 13 | Estes Express Lines
|
3,260,000 | - | 19,000 | 7,485 | 38,617 |
| 14 | 14 | ArcBest
|
2,988,310 | 39,985 | 13,000 | 4,137 | 23,639 |
| 15 | 16 | Penske Logistics
|
2,600,000 | - | 19,475 | 4,634 | 17,626 |
| 16 | 15 | Werner Enterprises
|
2,463,701 | 166,944 | 12,736 | 8,033 | 24,145 |
| 17 | 18 | Prime Inc.
|
2,288,397 | 307,504 | 4,900 | 7,416 | 14,116 |
| 18 | 19 | NFI
|
2,140,000 | - | 12,600 | 4,550 | 12,500 |
| 19 | 23 | R+L Carriers
|
1,972,000 | - | |||
| 20 | 17 | Roadrunner Freight
|
1,847,862 | -340,937 | 3,600 | ||
| 21 | 25 | Saia Inc.
|
1,786,735 | 113,719 | 10,400 | 4,779 | 16,376 |
| 22 | 27 | Kenan Advantage Group
|
1,758,645 | - | 9,400 | 6,977 | 11,225 |
| 23 | 21 | Daseke Inc. (TFI)
|
1,737,000 | -307,400 | 5,946 | 2,334 | |
| 24 | 20 | U.S. Xpress Enterprises
|
1,707,361 | -3,043 | 8,572 | 6,900 | 15,500 |
| 25 | 24 | CRST The Transportation Solution
|
1,559,000 | - | 6,778 | 5,808 | 14,513 |
| 26 | 26 | C.R. England
|
1,545,199 | - | 8,153 | 4,309 | 6,604 |
| 27 | 28 | Universal Logistics Holdings
|
1,511,998 | 37,586 | 6,541 | 5,343 | 4,428 |
| 28 | 22 | UniGroup
|
1,500,000 | - | |||
| 29 | 31 | Forward Air
|
1,410,395 | 87,099 | 5,652 | 1,353 | 7,178 |
| 30 | 29 | Sirva
|
1,400,000 | - | |||
| 31 | 30 | Southeastern Freight Lines
|
1,384,438 | - | 8,839 | 3,385 | 10,666 |
| 32 | 32 | Averitt Express
|
1,319,000 | - | 9,007 | 5,319 | 14,905 |
| 33 | 33 | Anderson Trucking Service
|
1,274,459 | - | 2,294 | 2,780 | 7,209 |
| 34 | 34 | Evans Delivery
|
1,240,000 | - | 430 | 6,200 | 550 |
| 35 | 35 | Crete Carrier Corp.
|
1,200,000 | - | 6,500 | ||
| 36 | 36 | Purolator
|
1,166,279 | - | 11,000 | 465 | 1,329 |
| 37 | 46 | Day & Ross
|
1,130,700 | - | 5,000 | 4,000 | 8,000 |
| 38 | 45 | Quality Carriers
|
1,090,684 | - | |||
| 39 | 37 | Lynden
|
1,075,000 | - | 3,039 | 998 | 2,679 |
| 40 | 39 | Ruan
|
1,002,045 | - | 5,900 | 3,704 | 9,661 |
| 41 | 40 | KLLM Transport Services
|
936,000 | - | 3,600 | 5,400 | |
| 42 | 41 | Atlas World Group
|
906,400 | 96,000 | 754 | 1,228 | 3,864 |
| 43 | 42 | Covenant Logistics Group
|
894,528 | 8,477 | 5,550 | 3,021 | 6,739 |
| 44 | 44 | Central Transport International
|
856,000 | - | |||
| 45 | 43 | Pitt Ohio
|
855,982 | - | 5,680 | 2,055 | 5,836 |
| 46 | 48 | Marten Transport
|
843,271 | 61,071 | 4,087 | 3,212 | 5,464 |
| 47 | 47 | Cardinal Logistics
|
805,000 | - | 4,220 | 3,055 | 8,700 |
| 48 | 49 | PS Logistics
|
747,339 | - | 3,664 | ||
| 49 | 51 | Stevens Transport
|
737,294 | 85,210 | 2,750 | 1,950 | 3,290 |
| 50 | 50 | AAA Cooper Transportation
|
718,000 | - | 5,000 | 2,552 | 6,958 |
| 51 | 54 | United Road Services
|
713,000 | - | 1,837 | 2,368 | 1,200 |
| 52 | 52 | Western Express
|
683,535 | - | 3,250 | 3,050 | 8,080 |
| 53 | 54 | Dayton Freight Lines
|
679,000 | - | 4,949 | 1,955 | 4,600 |
| 54 | 53 | Mullen Group
|
664,550 | - | 3,768 | 1,978 | 5,139 |
| 55 | 56 | Bennett Family of Cos.
|
650,846 | - | 1,029 | 1,810 | 2,186 |
| 56 | 62 | Bison Transport
|
633,817 | - | 3,688 | 2,185 | 5,711 |
| 57 | 61 | OnTrac Inc.
|
618,000 | - | |||
| 58 | 66 | Trimac Transportation
|
610,000 | - | 3,000 | 2,120 | 3,400 |
| 59 | 59 | Suddath
|
600,000 | - | 2,200 | ||
| 60 | 57 | Heartland Express
|
596,815 | 72,967 | 4,050 | 2,630 | 8,000 |
| 61 | 69 | Black Horse Carriers
|
561,000 | - | 4,040 | 1,958 | 4,500 |
| 62 | 73 | Hirschbach Motor Lines
|
550,530 | - | 1,141 | 1,887 | 3,503 |
| 63 | 58 | Mercer Transportation
|
543,651 | - | 301 | 2,383 | 2,600 |
| 64 | 67 | Canada Cartage
|
535,800 | 5,800 | 3,269 | 2,736 | 3,019 |
| 65 | 63 | Cowan Systems
|
533,012 | - | 2,397 | 2,279 | 6,782 |
| 66 | 70 | Two Men and a Truck Movers
|
524,929 | - | 11,396 | ||
| 67 | 64 | USA Truck
|
522,631 | -4,698 | 2,098 | 1,990 | 6,092 |
| 68 | 65 | P.A.M. Transport
|
514,177 | 7,900 | 2,666 | 2,130 | 7,081 |
| 69 | 60 | Jack Cooper Holdings
|
507,000 | - | 3,753 | ||
| 70 | 75 | A. Duie Pyle
|
491,100 | - | 3,281 | 1,209 | 2,285 |
| 71 | 74 | LaserShip Inc./OnTrac Inc.
|
452,000 | - | |||
| 72 | 72 | TMC Transportation
|
450,000 | - | |||
| 73 | 76 | Roehl Transport
|
438,659 | - | 2,702 | 2,040 | 5,481 |
| 74 | 68 | Dart Transit Co.
|
424,000 | - | 2,362 | ||
| 75 | 71 | 10 Roads Express
|
390,445 | - | |||
| 76 | 77 | Maverick USA
|
389,182 | - | 2,125 | 1,582 | 2,582 |
| 77 | 78 | Transport Investments
|
384,719 | - | 200 | ||
| 78 | 79 | Mesilla Valley Transportation
|
383,950 | - | 1,662 | ||
| 79 | 83 | Koch Cos.
|
351,081 | - | 1,224 | 1,164 | 5,540 |
| 80 | 80 | IMC Logistics
|
347,395 | - | 2,012 | ||
| 81 | 81 | Red Classic
|
342,100 | - | 1,275 | 577 | 2,918 |
| 82 | Salmon Cos.
|
341,073 | - | 824 | 1,104 | ||
| 83 | 89 | John Christner Trucking
|
338,873 | - | 207 | 839 | 1,244 |
| 84 | 95 | Challenger Motor Freight
|
335,000 | - | 1,200 | 1,570 | 3,550 |
| 85 | 82 | Foodliner/Quest Liner
|
334,103 | - | 1,315 | 1,317 | 2,340 |
| 86 | 86 | RoadOne IntermodaLogistics
|
314,000 | - | 2,200 | 1,700 | 350 |
| 87 | 85 | Melton Truck Lines
|
305,717 | - | 1,868 | 1,457 | 2,407 |
| 88 | Fastfrate Group
|
301,520 | - | 1,530 | 1,116 | 1,350 | |
| 89 | 86 | ContainerPort Group
|
300,000 | - | 400 | ||
| 90 | Dupré Logistics
|
297,582 | - | 1,313 | 750 | 1,471 | |
| 91 | 84 | TransAm Trucking
|
297,000 | - | |||
| 92 | 90 | Heniff Transportation Systems
|
293,000 | - | |||
| 93 | 86 | Trans-System
|
290,000 | - | 1,051 | 1,026 | 1,849 |
| 94 | 93 | Hansen & Adkins Auto Transport
|
283,137 | 6,622 | 955 | 1,224 | 945 |
| 95 | 97 | Martin Transportation Systems
|
276,978 | - | 2,357 | 1,264 | 2,417 |
| 96 | 95 | Quantix Supply Chain Solutions
|
276,000 | - | 1,100 | ||
| 97 | FFE Transportation Services
|
275,000 | - | 1,511 | 1,000 | 1,450 | |
| 98 | 98 | PGT Holdings
|
273,828 | - | 680 | 1,090 | 1,800 |
| 99 | Groendyke Transport
|
273,125 | - | ||||
| 100 | 99 | Superior Bulk Logistics
|
269,000 | - |
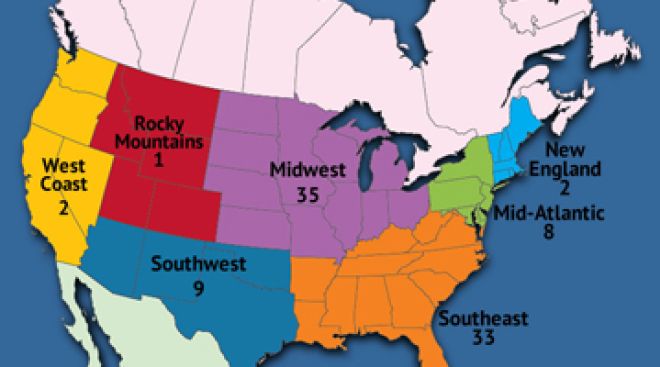
Top For-Hire Carriers on this list are common and contract freight carriers operating in the United States, Canada and Mexico. Companies are ranked on the basis of annual revenue. To be included in the Top 100 or any of the sectors, please send contact information to tteditor@ttnews.com. We will contact you via phone or e-mail to get information about your company prior to publication of the next Top 100 list.
* Tractor count includes company-owned, lease-to-own and owner-operator tractors.
On the Bubble


Retailers Offer ‘Returnless Refunds’ to Reduce Shipping Fees

Returnless refunds are a tool that more retailers are using to keep online shoppers happy and to reduce shipping fees, processing time and other ballooning costs from returned products.
Werner Revenue and Profit Decline on Q3 Market Struggles

The Omaha, Neb.-based carrier’s Q3 net income fell 72% to $6.6 million, or 11 cents per share, compared with $23.7 million, 37 cents, a year ago.
October 30, 2024XPO Net Income Climbs 10% on Strong LTL Pricing in Q3

XPO’s North American LTL segment, its core operation, increased revenue by 1.9% to $1.25 billion from $1.23 billion last year despite declines in shipment volumes.
October 30, 2024Covenant's Q3 Net Income and Revenue Take Slight Dips

The company reported third-quarter net income of $13 million, or 94 cents per share, compared with $13.5 million, 99 cents, in the year-ago period.
October 29, 2024Saia Reports Q3 Revenue Growth Amid Network Expansion

Saia Inc. reported Oct. 25 that it was able to post record-high third-quarter revenue amid an ongoing effort to expand its operational footprint.
Anchorage’s International Airport Adds 5 Carriers

The Ted Stevens Anchorage International Airport has added five new international cargo carriers to its lineup this year, setting the stage for continued growth.
Ryder Q3 Profit Slides Even as Acquisitions Boost Revenue

Looking forward, Chief Financial Officer John Diez said Ryder expects earnings growth in the fourth quarter as a result of its contractual portfolio.
Mullen Group Q3 Earnings Dip Despite Revenue Growth

The Okotoks, Alberta-based company posted net income of C$38.3 million, or 41 cents a diluted share, for the three months ending Sept. 30.
Knight-Swift Reports Nearly $1.9B in Revenue for Q3

Knight-Swift Transportation Holdings experienced a 49.4% decline in earnings year over year during the third quarter of 2024, the company reported Oct. 23.
UPS Sees Profit Growth for First Time in Nearly Two Years

UPS Inc. posted a year-over-year increase in revenue during the third quarter of 2024 despite challenging market conditions, the company reported Oct. 24.
-

2023
-
2022
-
2021
-
2020
-
2019
-
2018
-
2017
-
2016
-
2015
-
2014
-
2013
-
2012
-
2011
-
2010
-
2009
-
2008
-
2007
-
2006
-
2005
-
2004


